The implementation shortfall (IS) metric is most important measure of trade cost used in finance. It’s important to note that:
- It’s ex post (after the trade).
- Provide total cost measure associated with trading.
- Spans the time between investment decision is made by the portfolio manager up to completion of the trade by the trader.
- Allow to identify all costs arising during implementation of the trade.
The key idea behind the IS is simple. It’s a difference between:
- return for a paper portfolio (where all transactions are assumed to take place at the managers decision price)
vs
- actual portfolio’s return (which reflects realized transactions, including all fees and costs).
The implementation shortfall = Paper return – Actual return
The paper return shows the hypothetical return that the fund would have received if the manager were able to transact all shares at the desired decision price and without any associated costs or fees (i.e., with no friction).
Paper return is unrealistic, perfect scenario. Unreal honestly. But that’s the benchmark for IS. It’s actually advantage of this approach, because it shows all kinds of costs associated with trading (whether justified in your opinion or not).
You could point finger on the chart and say: “I’d buy here, and I’d sell there.” No transaction costs, no liquidity issues, no market impact, no nothing. Perfect world.
Let’s say you noticed a short-alpha opportunity – the stock is priced at $40. You want to buy 1,000 shares. At the end of the day, the stock closes at $48. The profit per share is $8. You wanted 1,000 shares, so the total profit is $8 * 1,000 = $8,000. That’s the paper return.
It’s a long way to arrive at the actual return – you have to account for all the costs along the way. Let’s take a look at them.
All trading costs according to IS:
- Fixed fees: These are transactional commissions. For example, if you paid $0.05 per share in commissions, that’s your fixed fee.
- Execution cost: This occurs when you wanted to buy at $40 but managed to buy at $43, which is $3 higher. These $3 per share are your execution costs.
- Opportunity cost: This happens when you wanted to buy 1,000 shares but managed to fill only 700 shares. You missed profits for 300 shares, which is your opportunity cost. Important! You can avoid these by investing uninvested funds into the second most attractive asset.
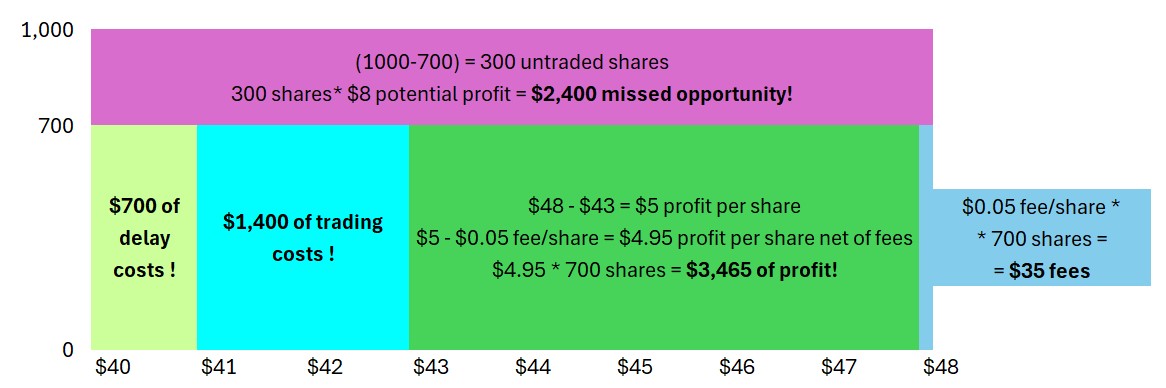
Let’s take the above example. Recall that the paper return is:
($48 – $40) * 1,000 shares = $8,000 profit
Let’s account for costs to arrive at the actual return.
- Opportunity cost: Let’s say you managed to buy only 700 shares. The profit for 300 shares is a missed opportunity. This is $8 profit per share * 300 untraded shares = $2,400.
- Fixed fees: Let’s say you paid $0.05 for each traded share. Your cost here is $0.05 * 700 shares = $35.
- Execution cost: You made the decision when the price was $40, but your trader managed to buy shares at an average price of $43. Your execution cost is ($43 – $40) * 700 shares = $2,100.
Your actual return is: $8,000 – $2,400 – $35 – $2,100 = $3,465.
Graphically, it will look like this.

Execution costs = Delay cost + Trading cost
Also, execution costs can be further divided into delay costs and trading costs.
- Delay cost: You decided to buy a stock at $40, but your trader took too long to choose a broker and sent your order when the stock price was already $41. This $1 per share is your delay cost (part of the execution cost). For example, $1 * 700 traded shares = $700 of delay cost.
- Trading cost: Your order arrived at the market when the price was $41, but you managed to buy shares for an average price of $43. Another $2 per share is added to your cost, this time as trading costs (part of the execution cost). For example, $2 * 700 traded shares = $1,400 of trading cost.
Both delay cost ($700) and trading cost ($1,400) sum up to the total execution cost ($2,100). Hope that’s clear!
Let’s continue with the above example and illustrate delay and trading costs graphically.

Remember! Don’t confuse trading costs with commissions/fees!
- Trading costs are associated with market impact and are implicit costs, which you incur through a higher average price of shares.
- Fixed fees and commissions are explicit (visible) costs that you pay directly to the broker.
Okay, having read the above, you should already grasp the topic and understand it well. Let’s take a closer look at the definitions of these costs. You need the details and definitions to answer some tricky questions.
Fixed fees – The fixed fees component includes all explicit fees, such as commissions, exchange fees, and taxes.
Opportunity cost corresponds to the unexecuted shares of the order. It is the cost associated with not being able to transact the entire order at the manager’s decision price and is due to adverse price movement over the trading period. Opportunity cost may also arise in times of insufficient market liquidity, when the fund is not able to find counterparties to complete the trade. The opportunity cost component provides managers with insight into missed profit opportunity for their investment idea.
Important: With proper cost management practices, you can determine prior to the trade that you can’t purchase all the shares. This allows you to redirect your funds into the second-best investment and avoid opportunity costs.
Execution cost corresponds to the shares that were transacted in the market. Execution cost occurs from the buying and/or selling pressure of the order, which often causes buy orders to become more expensive and sell orders to decrease in value, thus causing the fund to incur higher costs and lower realized returns. Execution cost will also occur owing to price drift over the trading period. For example, buying stocks that are increasing in value over the trading period and selling stocks that are decreasing in value over the trading period
- Delay cost arises when the order is not submitted to the market in a timely manner and the asset experiences adverse price movement, making it more expensive to transact. Delay cost is often caused by a delay in selecting the most appropriate broker or trading algorithm to execute the order and by adverse price movement (also known as price drift) over the trading period.
- Trading costs are implicit expenses associated with market impact, where the average price of shares filled is higher than desired due to factors such as market impact, rising market prices, liquidity constraints, order size, and volatility.
Let’s review some types of prices:
- Decision price. Represents the security price at the time the portfolio manager made the decision to buy or sell the security.
- Arrival price. The price of the security at the time the order is entered into the market for execution. (It applies to orders that are eventually filled. For example, if a trader placed an order yesterday when the price was $41, but no shares were filled, and tried again today when the price was $42 and the order is filled, the arrival price is $42, not $41.)
- Closing Price, Market on Close (MOC). The closing price of the security on the day is often used by index managers and mutual funds. These managers aim to achieve the closing price on the day and compare their actual transaction prices with the closing price, as this is the price at which their funds will be valued.
- Previous close. Refers to the security’s closing price on the previous trading day.
- Opening Price. References the security’s opening price for the day.
There are other prices/benchmarks, but they are rather irrelevant for discussing implementation shortfall.
Can the costs be negative?
- Fixed fees: Of course not. No broker will pay you for trading. You always pay them.
- Opportunity costs: Probably not. If you filled all the shares you wanted, the opportunity cost is zero. Buying more does not mean the opportunity cost is negative. Opportunity costs arise due to two reasons: adverse price movement or illiquidity.
- Adverse price movements cause opportunity costs to be positive, as you end up paying more than intended.
- In the case of illiquidity, if the price drops from $40 to $39 (due to delay), the portfolio manager is more motivated to buy shares. Negative opportunity costs, where the trader can’t buy all shares at the lower price, are unlikely. The manager would push to buy shares even with higher market impact, keeping the price still favorable. Thus, while we can imagine a highly improbable situation where a delay causes a price drop (price improvement), negative opportunity costs are highly improbable in practice.
- Execution costs: Yes! These can be negative. Let’s split it further:
- Delay costs: These can be negative. If your trader delayed entering the order and the security price fell, you will experience price improvement due to the delay cost.
- Trading costs: These too can be negative, but it is rarer than delay costs. Consider a case when you are buying in a falling market, and the trader splits your order into buckets. Each bucket of shares is bought at a lower price. In this case, the average price of shares can indeed be better than the decision price.
Costs as Basis Points (bps)
Remember, a basis point is 1/10,000, which equals 0.01% or 0.0001.
- 1% is 100 bps.
- 10% is 1,000 bps.
- 100% is 10,000 bps.
When measuring costs in Implementation Shortfall, you divide the costs by your intended position value. Let’s analyze the above example:
Your intended position was $40 * 1,000 shares = $40,000.
Your costs:
- Opportunity cost: $2,400 / $40,000 = 6% = 600 bps
- Fixed fees: $35 / $40,000 = 0.0875% = 8.75 bps
- Execution cost: $2,100 / $40,000 = 5.25% = 525 bps
- Total costs: 1133.75 bps (11.3375%). Let’s check: $40,000 * 11.3375% = $4,535
Pro-tip: Write the cost as a percentage (e.g., 5.25%), then remove the decimal point and replace “%” with “bps” (525 bps).
Join the Conversation
I encourage you to engage by commenting the post and sharing with your fellow CFA candidates. Your participation helps create a vibrant learning community where we can all benefit from shared knowledge and experiences.
Stay tuned for the next article!