Read this, and you will never struggle with yield curve movement questions again!
This is the third article about this topic. Check the other two:
- CFA Level 3: Yield Curve Moves, Part 1 – Level and Slope – Shifts
- CFA Level 3: Yield Curve Moves, Part 2 – Shifts Additional Points – Inverted Curve
We discussed thoroughly change in levels and in slope separately and combined, also in the inverted curve environment. Let’s examine third type of move – change in curvature.
What’s the curvature?
Curvature refers to the shape of the yield curve, which illustrates the relationship between short-term, mid-term, and long-term interest rates. A straight line would have zero curvature. The more the yield curve deviates from a straight line, the more curvature it has. Typically, curvature is positive because yield curves tend to be upward sloping at the short end and flatten or even invert at the long end. A “humped” curve indicates significant curvature, where mid-term yields are higher than both short-term and long-term yields.

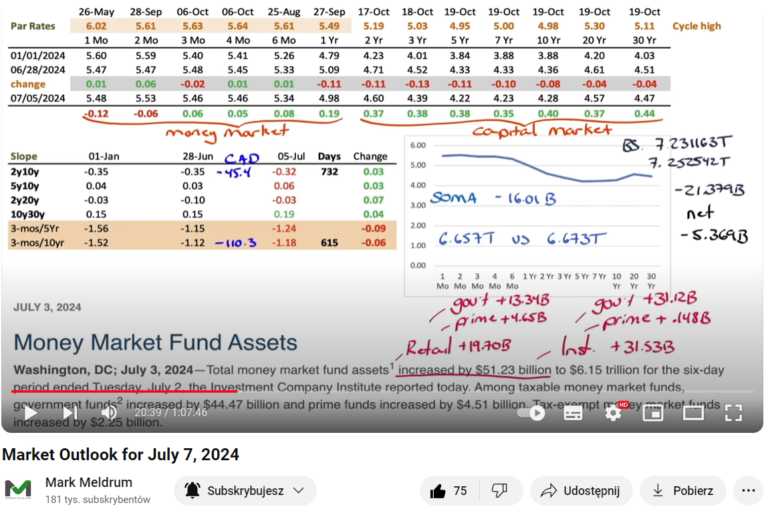
Curvature can be negative in an inverted yield curve environment. This unusual behavior of interest rates is happening now. Take a look at the chart on the right from Mark Meldrum’s market update on July 7, 2024. It shows an inverted yield curve with a “humped inside” shape, indicating convexity instead of the usual concavity.
You can think of (and remember) it as a smile. (By the way, do you remember the volatility smile? It has a similar shape and curvature.)


How it is measured?
Measurement of the yield curve is quite easy. You need to calculate how it is different from a straight line. You need to extract the short-term rate and long-term rate from two mid-term rates.
Curvature = 2 * Mid-term rate – Short-term rate – Long-term rate
For the straight line it will be 0 (no curvature), right? Let’s check this. Straight line would be:
- Shot-term rate – 2%
- Mid-term rate – 3%
- Long-term rate – 4%
Curvature = 2*3% – 2% – 4% = 6% – 2% – 4% = 0%
What’s the current curvature of the yield curve? (Go back to the MM’s market update screen.) Let’s take 1-year rate (4.98%), 5y rate (4.22%) and 30y rate (4.47%).
- 1-year rate: 4.98%
- 5-year rate: 4.22%
- 30-year rate: 4.47%
Curvature = 2*4.22% – 4.98% – 4.47% = -1.01%
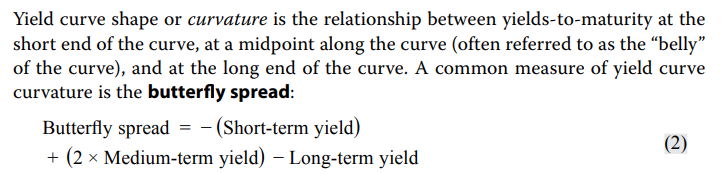
As we noted, the curvature is inverted and negative, indicating a “humped inside” or convex shape. This measure of curvature is often referred to as the “butterfly spread”. Here’s the formula from the CFAI books:
What’s the twist, and how it’s different from level or slope change?
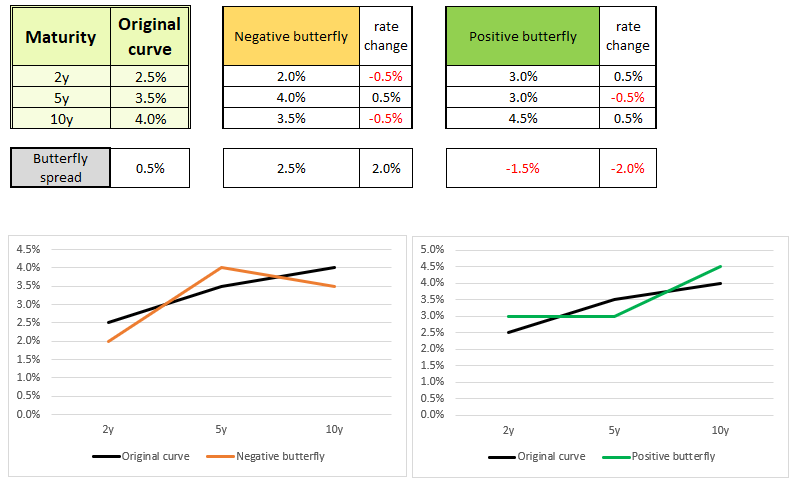
A twist refers to a change in the shape/curvature of the yield curve. It usually associated when mid-term rates move in a different direction than short-term and long-term rates. These movements are called butterfly twists and can be of two types:
- Positive butterfly twist – Mid-term rates (body of the butterfly) go down, and short-term and long-term rates (wings of the butterfly) go up. Notice, this means the butterfly spread is getting a negative impact!
Positive butterfly twist = negative impact on the butterfly spread. - Negative butterfly twist – Mid-term rates (body of the butterfly) go up, and short-term and long-term rates (wings of the butterfly) go down. Notice, this means the butterfly spread is getting a positive impact!
Negative butterfly twist = positive impact on the butterfly spread.
Let’s illustrate this with an example.
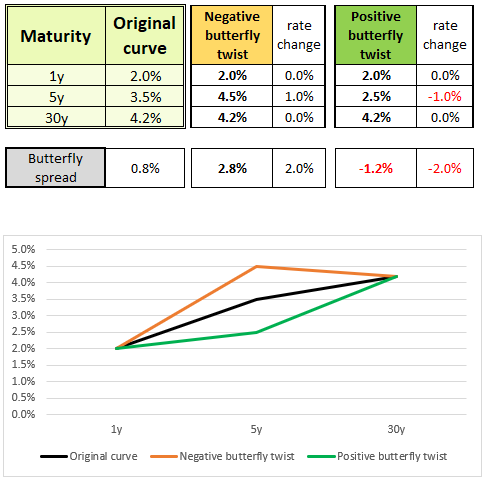
For simplicity, assume that the 1-year and 30-year rates remain unchanged in both movements.
- For a negative butterfly twist: The 5-year rate increases by 1%, which means the butterfly spread increases by 2%. The body (mid-term rate) goes up, and the wings (short-term and long-term rates) are relatively lower than before.
- For a positive butterfly twist: The 5-year rate decreases by 1%, which means the butterfly spread decreases by 2%. The body goes down, and the wings are relatively higher than before.
What was the twist last week on the market?
Having this knowledge now and based on the screen from MM’s market update, can you tell what the move on the yield curve was last week? Consider the 1-year, 5-year, and 30-year rates.
- Both the 1-year and 5-year rates decreased by 0.11%, indicating a pure change in level for these two rates. This overall decline is a bullish signal.
- The 30-year rate decreased only by 0.04%, suggesting a change in slope (bull steepening) for the 5-year to 30-year spread.
Let’s check the change in curvature:
Change in curvature (butterfly spread) = 2 * (-0.11%) – (-0.11%) – (-0.04%) = -0.07%
The butterfly spread has decreased (a negative change), indicating a positive butterfly twist. This means the mid-term rate went down, while the short-term and long-term rates went up or decreased less, as in this case.
Okey, how to trade it (based on your expectation towards yield curve movements)
First of all, do you want a (mostly) costless solution? If yes, then you need a duration-neutral solution. What does this mean? You go long and short at the same time. For instance, if a 10-year bond has a duration of 7.5 and a 2-year bond has a duration of 1.5, to arrive at a duration-neutral position, you need to:
- Long 10-year bond (+7.5 duration), and
- Short five (7.5/1.5=5) 2-year bonds (-7.5 duration).
Your duration will be net zero. You will be immune to changes in levels of rates. Change in levels will be irrelevant for you. Your portfolio will be affected only by changes in slope and curvature.
If reducing the cost and duration neutrality is not a requirement, you need to just position your portfolio towards one or all expected moves. Remember that there is inverse relation between rates and bonds price (rates go down, bond prices go up).
For positive butterfly twist you expect the body to go down and the wings to go up, right? If mid-term rates go down, bond prices go up, so you need to go long on mid-term bonds. Alternatively, you can short short-term and/or long-term bonds, as you expect these rates to go up (bond prices down).
For a negative butterfly twist, it’s exactly the opposite:
- Short-term and long-term rates go down, meaning bond prices go up. You go long.
- Mid-term rates go up, meaning bond prices go down. You go short here.
There is a shortcut describing it: barbell and bullet portfolio.
Barbell versus Bullet portfolio
A barbell strategy involves buying both short-term and long-term bonds. This approach provides a two-fold exposure and resembles the shape of a barbell.

A bullet strategy involves buying mid-term bonds, focusing the portfolio on maturities concentrated in a specific time frame, resembling the shape of a bullet.
Remember, these are just conceptual terms. A portfolio that is more concentrated on mid-term maturities will be considered a bullet. It doesn’t necessarily have to include only one maturity.
For example:
- if Portfolio A has 1-year and 30-year bonds, and Portfolio B has bonds with 2-year, 5-year, and 10-year maturities, Portfolio B will be considered (more of) a bullet (compared to Portfolio A).
- Similarly, if Portfolio C has only 5-year bonds, and Portfolio D has 4-year and 6-year bonds, Portfolio D will be considered (more of) a barbell (compared to Portfolio C).
How to use these to describe portfolio for butterfly twists?
If you expect:
- Positive butterfly twist (negative impact on butterfly spread, it means:
- Body down: mid-term rates down, mid-term bonds up – Bullet long.
- Wings up: short-term and long-term rates up, short-term and long-term bonds down – Barbell short.
- Negative butterfly twist – exactly the opposite.
- Body up – Bullet short,
- Wings down – Barbell long.
How to trade each discussed move. Let’s describe them all!
I hope it’s obvious for you at this point, but let’s write this up.
Downward change in levels (bull)
- Rates are generally going down, so you need to go long on bonds as their prices will go up. Ideally, choose bonds with the highest duration as they are most sensitive to rate changes. In general, you increase your portfolio’s duration level.
Upward change in levels (bear)
- Rates are generally going up, so you need to short bonds as their prices will go down. Ideally, choose bonds again with the highest duration as they are most sensitive to rate changes. In general, you decrease your portfolio’s duration level.
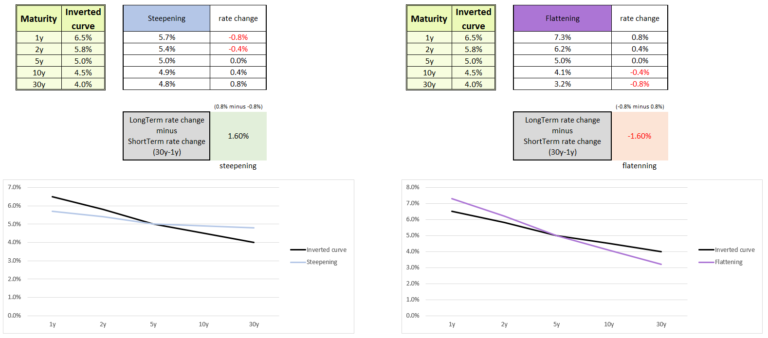
Change in slope – steepening
- The yield curve is getting more upward-sloping, meaning long-term rates go up and short-term rates go down. You short long-term bonds and go long on short-term bonds.
Change in slope – flattening
- The yield curve is getting less upward-sloping, meaning long-term rates go down and short-term rates go up. You go long on long-term bonds and short on short-term bonds.
Change in level + change in slope
- Bull flattening – increase duration, long LT bonds and short ST bonds.
- Bull steepening – increase duration, short LT bonds and long ST bonds.
- Bear steepening – decrease duration, short LT bonds and long ST bonds.
- Bear flattening – decrease duration, long LT bonds and short ST bonds.
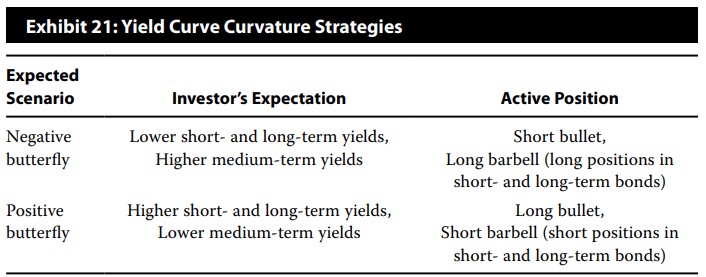
Positive butterfly twist
- Wings up (short-term and long-term rates) means these bonds will depreciate. Go short. Short Barbell.
- Body down (mid-term rate) means these bonds will appreciate. Long. Long Bullet.
Negative butterfly twist
- Wings down means these bonds will appreciate. Long. Long Barbell.
- Body up (mid-term rate) means these bonds will depreciate. Short. Short Bullet.
What about the Rolling Down the Yield Curve strategy?
To apply this strategy, you need to understand what it exactly does.
Rolling Down the Yield Curve (RDYC) involves buying bonds with longer maturities than your investment horizon. This means you will not hold these bonds until maturity and will have to sell them at some point in the future. As time passes, the maturity of these bonds will shorten. You rely on the respective rate being lower when you sell the bonds compared to the yield when you bought them. This can happen when you expect rates to go down or anticipate an upward-sloping yield curve to remain stable.
For instance, if your investment horizon is 1 year and you notice the yield curve is steepest between 4 years and 5 years, at 3% and 5% respectively. You expect the yield curve to remain stable. You would buy a 5-year bond with a 5% coupon and hold it for 1 year. After one year, your bond with 4 years to maturity is still paying a 5% coupon, but the 4-year yield on the yield curve remained at 3%. You will sell the bond at a significant premium and will pocket additional money from rolling down the yield curve.
Another example is when the yield curve is flat (let’s say at 4%), but you expect rates to drop across the curve in one year. You buy a long-term bond (with the highest duration) and hold it for 1 year. After 1 year, rates dropped to 3%, you can sell the bond at a profit (gaining additional profit from rolling down the yield curve).
When to use RDYC?
- You expect rates to drop.
- The yield curve is upward-sloping, and you expect it to remain stable.
Important: In general, the yield when you sell the bond must be lower than when you bought it.
Can you apply RDYC when the yield curve is inverted (as it is now)?
It depends. If you expect the yield curve to remain stable, then RDYC will result in a loss. However, what if you expect the yields to drop significantly in 1 year? Many today expect this. If rates drop low enough, your RDYC strategy, applied when the yield curve was inverted, will profit! The yield curve doesn’t even need to un-invert; rates just need to drop low enough. How? Let’s see.
Example curve is inverted:
- 1-year at 6%,
- 2-year at 5%,
- 4-year at 4%, and
- 5-year at 3%.
You apply RDYC and buy a 5-year bond with a 3% yield, expecting rates to drop by 2.5% while the yield curve remains inverted.
After 1 year, you have a 4-year bond and the rate for that maturity is 1.5% (4% – 2.5%). You bought the bond with a 3% yield and sold it with a 1.5% yield—resulting in a profit!
Even though the yield curve was and still is inverted. (Please note that this example is just for illustration—these circumstances are very unlikely to happen in the real world.)
<<< Go back to part 2: CFA Level 3: Yield Curve Moves, Part 2 – Shifts Additional Points – Inverted Curve


This is cool stuff. Well done