Read this, and you will never struggle with yield curve movement questions again!
This is the second article about this topic. Check the other two:
- CFA Level 3: Yield Curve Moves, Part 1 – Level and Slope – Shifts
- CFA Level 3: Yield Curve Moves, Part 3 – Twists, Barbell vs Bullet, Rolling Down the Yield Curve
We previously discussed changes in level and slope. I mentioned that we should pay attention to the math as it’s decisive, not the visuals. Visuals might fool you in an inverted curve environment. This is important!
Let’s measure and calculate steepening or flattening. It is measured by the difference between long-term rates and short-term rates. Let’s take the 30-year and 1-year rates to measure the change in slope for each case described in the previous article. It should be straightforward and just a recall.

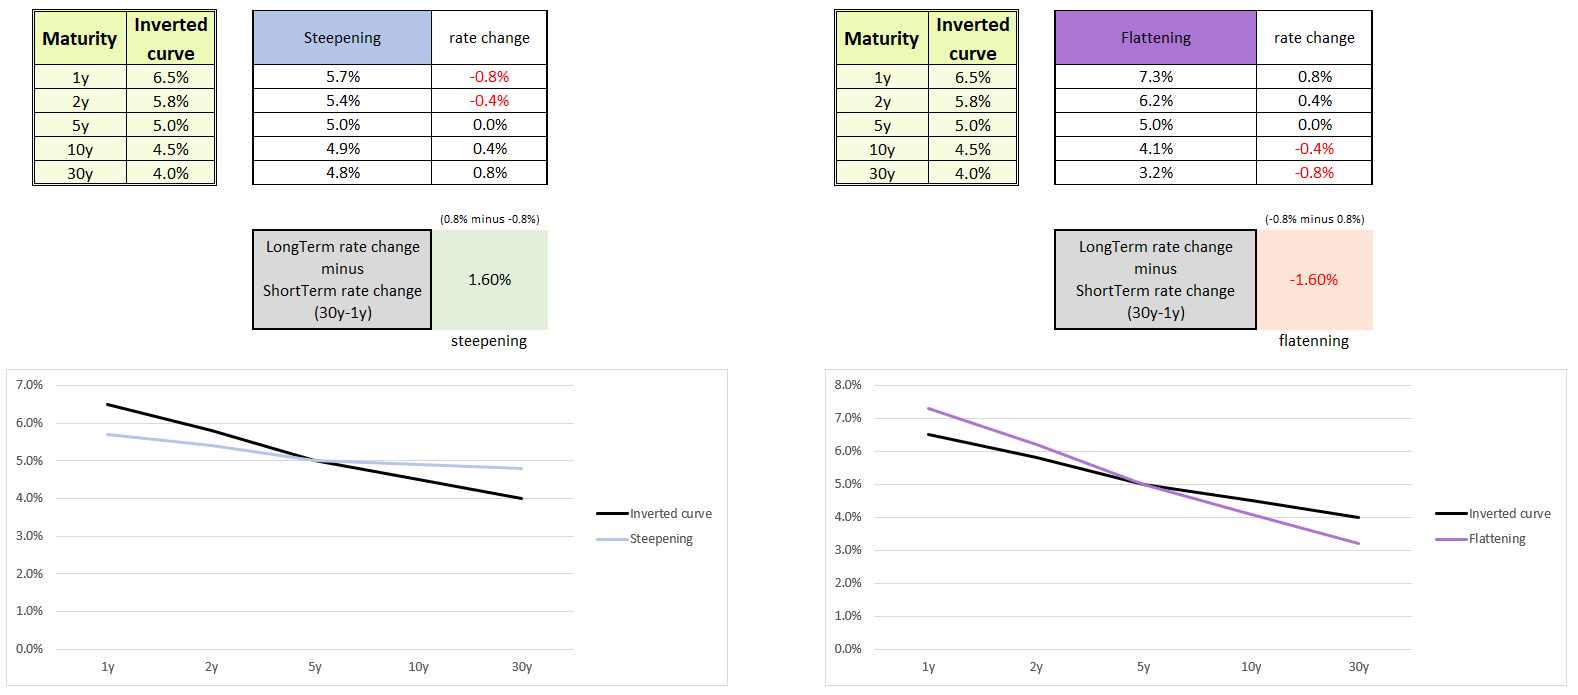
Now, let’s see how it goes when the yield curve is inverted. Our original curve is inverted, with the 1-year rate at 6.5% and the 30-year rate at 4%.

Take a look at the steepening curve (blue). The 30-year rate increased by 0.8% and the 1-year rate decreased by 0.8% (changed by -0.8%). The change in slope is: 0.8% – (-0.8%) = +1.6%. The change in difference is positive, so it’s clearly steepening! However, if you look at the chart, the steepening curve appears flatter, right? That’s why you should always define the change in slope by the mathematical difference between the long-term rate and the short-term rate, not by looking at the chart!
Let’s check the flattening curve (violet) for the record. The 30-year rate decreased and the 1-year rate increased. The change in slope is -1.6%. Despite the chart showing the flattening curve as steeper, it’s actually flattening.
This is important as we are currently in an inverted yield curve environment.

Take a look at Mark Meldrum’s market update from June 30th, 2024. (Data are as of this date.)
- The 2y10y yield curve has been inverted by 0.35% for 725 days already! (The 2-year rate is 4.71%, and the 10-year rate is 4.36%.)
- The 3m10y yield curve is inverted by as much as 1.12% for 608 days.
Why is this happening? Short-term rates are closely aligned with the Fed Funds Rate, which is 5.25%-5.5%. However, long-term rates depend on inflation and growth expectations. These inversions generally occur when investors expect an economic slowdown or lower future interest rates, prompting higher demand for long-term securities and pushing their yields down relative to short-term rates.
Also, in this weekly update, long-term rates have increased more than short-term ones. What is the name of this move? (Try to answer yourself. If you don’t know, check the bottom left of the first screen in this article.)
<<< Go back to part 1:CFA Level 3: Yield Curve Moves, Part 1 – Level and Slope – Shifts
>>> Go to part 3: CFA Level 3: Yield Curve Moves, Part 3 – Twists, Barbell vs Bullet, Rolling Down the Yield Curve