Read this, and you will never struggle with yield curve movement questions again!
This is the first article about this topic. Check the other two:
- CFA Level 3: Yield Curve Moves, Part 2 – Shifts Additional Points – Inverted Curve
- CFA Level 3: Yield Curve Moves, Part 3 – Twists, Barbell vs Bullet, Rolling Down the Yield Curve
When actively managing our fixed income/bond portfolio, we can expect and position for three types of yield curve movements:
- Level
- Slope
- Shape (curvature).
The yield curve illustrates the term structure of interest rates for government or benchmark securities, assuming that all promised principal and interest payments are made (neither credit nor liquidity risk is included).
All these movements can happen simultaneously and in combination. We will discuss all important combinations.
Parallel change in level – parallel shift
For starters, please remember:
- when rates go down, it’s bullish;
- when rates go up, it’s bearish!
If rates go down equally along the entire curve (this is rare but the simplest case), it’s a parallel shift downward.
If rates go up equally along the entire curve (this is rare but the simplest case), it’s a parallel shift upward.
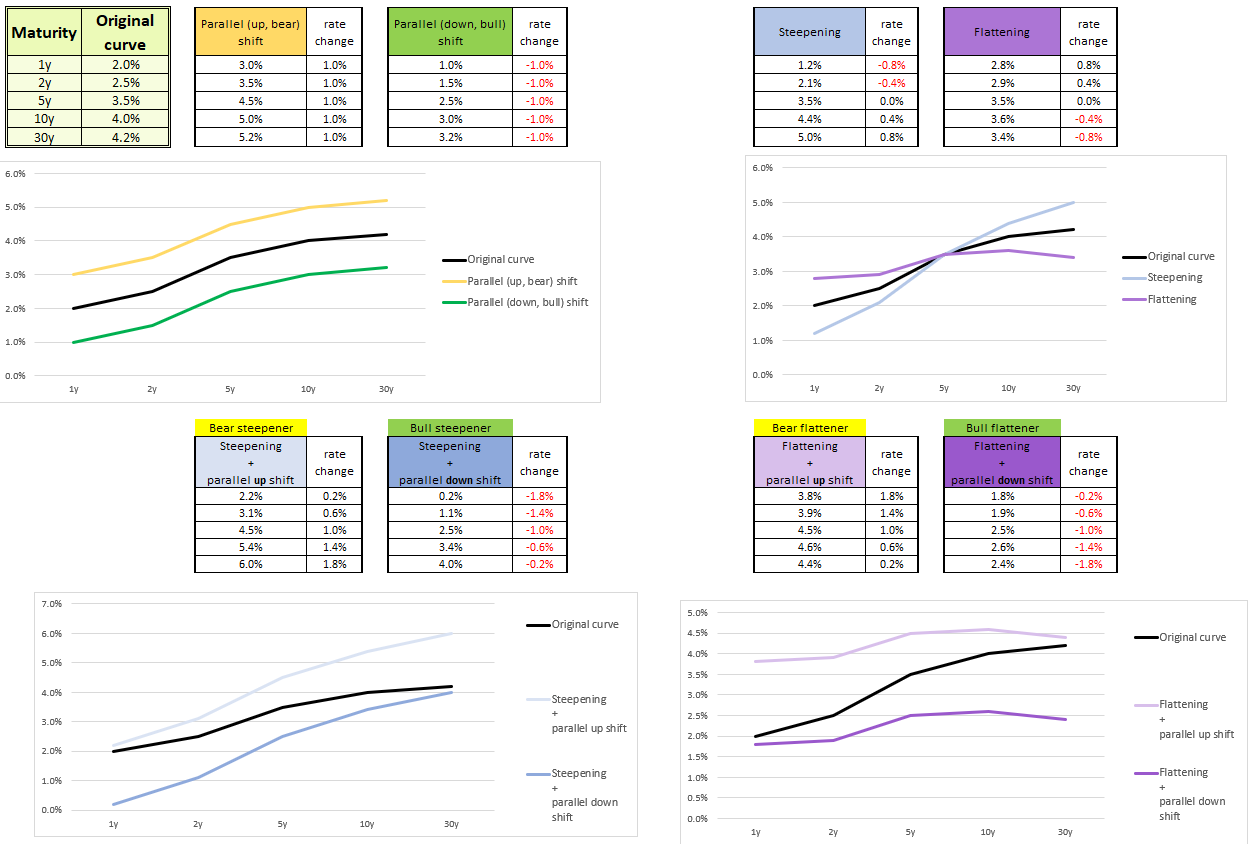
Consider a yield curve consisting of 1-year, 2-year, 5-year, 10-year, and 30-year maturities (black line). If all rates change by +1%, the entire curve will shift up (yellow line). If all rates change by -1%, the entire curve will shift down (green line). This is a pure change of levels.

Change in slope without change in levels
What about slope? Let’s consider a change in slope without a change in levels. This will be steepening or flattening. To measure this, you need to calculate the difference between long-term and short-term yields. If this number goes up, it’s steepening. If this number goes down, it’s flattening.
Long term yield – Short term yield = Change in slope
Remember, the graph is useful for visualization, but the mathematical formula is decisive.
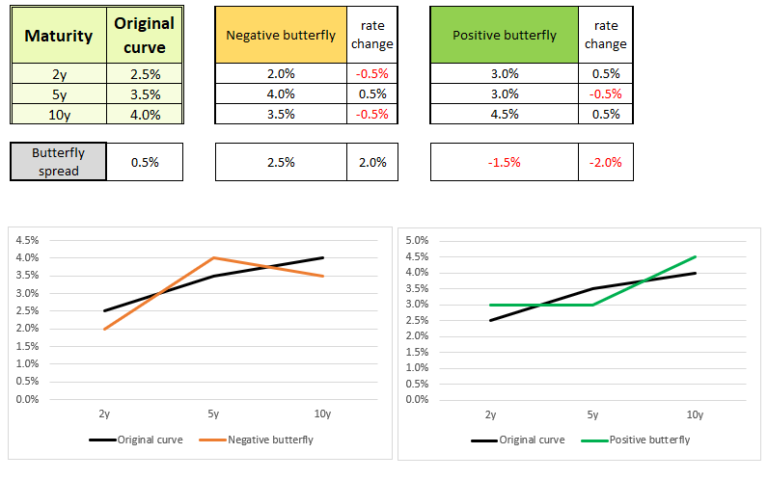
Consider these two curves:
- For the blue curve, the change in long-term yield (0.8%) minus the change in short-term yield (-0.8%) is positive and equals 1.6%.
- For the violet curve, the change in long-term yield (-0.8%) minus the change in short-term yield (0.8%) is negative and equals -1.6%.
The slopes have changed without changing the levels.

Parallel change in level + change in slope = non-nparallel shift
Let’s combine these two moves. A parallel shift (pure change in levels) is rare. A change in slope without a change in levels is unusual. Most likely, we will see a change in level that is not parallel (not equal across the curve), meaning yields will change in the same direction but not with the same magnitude.
In other words, a parallel shift + a change in slope = a non-parallel shift. There are four options: two steepeners and two flatteners.
Let’s examine the steepeners first, bull (up) and bear (down).
If we combine steepening with rising rates, it’s a bear steepener (light blue). Rates are rising, but long-term rates are rising more. The yield curve is higher and steeper than the original curve.
If we combine steepening with declining rates, it’s a bull steepener (dark blue). Rates are declining, but long-term rates are declining less. The yield curve is lower and steeper than the original curve.

Now, let’s take a look at flatteners, both bull (up) and bear (down).
If we combine flattening with rising rates, it’s a bear flattener (light violet). Rates are rising, but long-term rates are rising less. The yield curve is higher and flatter than the original curve.
If we combine flattening with declining rates, it’s a bull flattener (dark violet). Rates are declining, but long-term rates are declining more. The yield curve is lower and flatter than the original curve.

Remember, the discussed moves are changes in slope, not in curvature. (Change is curvature is discussed in different article.) A change in slope for bear steepeners means:
- long-term rates are rising more than short-term ones,
- and mid-term rates are rising less than long-term rates but more than short-term rates.
Bear steepener: change in short-term (ST) rates < change in mid-term rates < change in long-term (LT) rates
Why does the curriculum tell me that I ought to trade a bear steepener by going short duration?
Inspired by this Reddit post, I’m providing my view on this:
Duration in general, in the case of a bear move, is much more profitable than shape or curvature trade.
If you forecast a bear steepener, it means rates go up (bear), so you should short duration. Also, long-term rates go up more than short-term rates (steepener), so the long end is going significantly higher! The best strategy here is to short the long end, not a shape trade. (This is why the CFA is valuable – you might be discouraged by seeming discrepancies and inconsistencies, but this is actually a smart move/trade, not a “book trade”, right?)
If you forecast steepening but are not sure if it’s a bull or bear, then a shape trade and duration-neutral strategy will be more appropriate.
You may switch to a beta trade to better comprehend this. Let’s say you think big tech stocks will perform better than REITs. You have two options:
- Go beta-neutral, which means going long on big tech stocks and short on REITs.
- Take beta exposure and just go long on big tech stocks.
Which one do you think is better?
This topic is challenging until it clicks. Once you wrap your head around it, it gets much easier afterward. I strongly recommend checking some examples and trying to play with the names of yield curve moves.
Go to part 2: CFA Level 3: Yield Curve Moves, Part 2 – Shifts Additional Points – Inverted Curve